Pydantic Logfire Debugging and Monitoring
Applications that use LLMs have some challenges that are well known and understood: LLMs are slow, unreliable and expensive.
These applications also have some challenges that most developers have encountered much less often: LLMs are fickle and non-deterministic. Subtle changes in a prompt can completely change a model's performance, and there's no EXPLAIN query you can run to understand why.
Warning
From a software engineers point of view, you can think of LLMs as the worst database you've ever heard of, but worse.
If LLMs weren't so bloody useful, we'd never touch them.
To build successful applications with LLMs, we need new tools to understand both model performance, and the behavior of applications that rely on them.
LLM Observability tools that just let you understand how your model is performing are useless: making API calls to an LLM is easy, it's building that into an application that's hard.
Pydantic Logfire
Pydantic Logfire is an observability platform developed by the team who created and maintain Pydantic Validation and Pydantic AI. Logfire aims to let you understand your entire application: Gen AI, classic predictive AI, HTTP traffic, database queries and everything else a modern application needs, all using OpenTelemetry.
Pydantic Logfire is a commercial product
Logfire is a commercially supported, hosted platform with an extremely generous and perpetual free tier. You can sign up and start using Logfire in a couple of minutes. Logfire can also be self-hosted on the enterprise tier.
Pydantic AI has built-in (but optional) support for Logfire. That means if the logfire package is installed and configured and agent instrumentation is enabled then detailed information about agent runs is sent to Logfire. Otherwise there's virtually no overhead and nothing is sent.
Here's an example showing details of running the Weather Agent in Logfire:
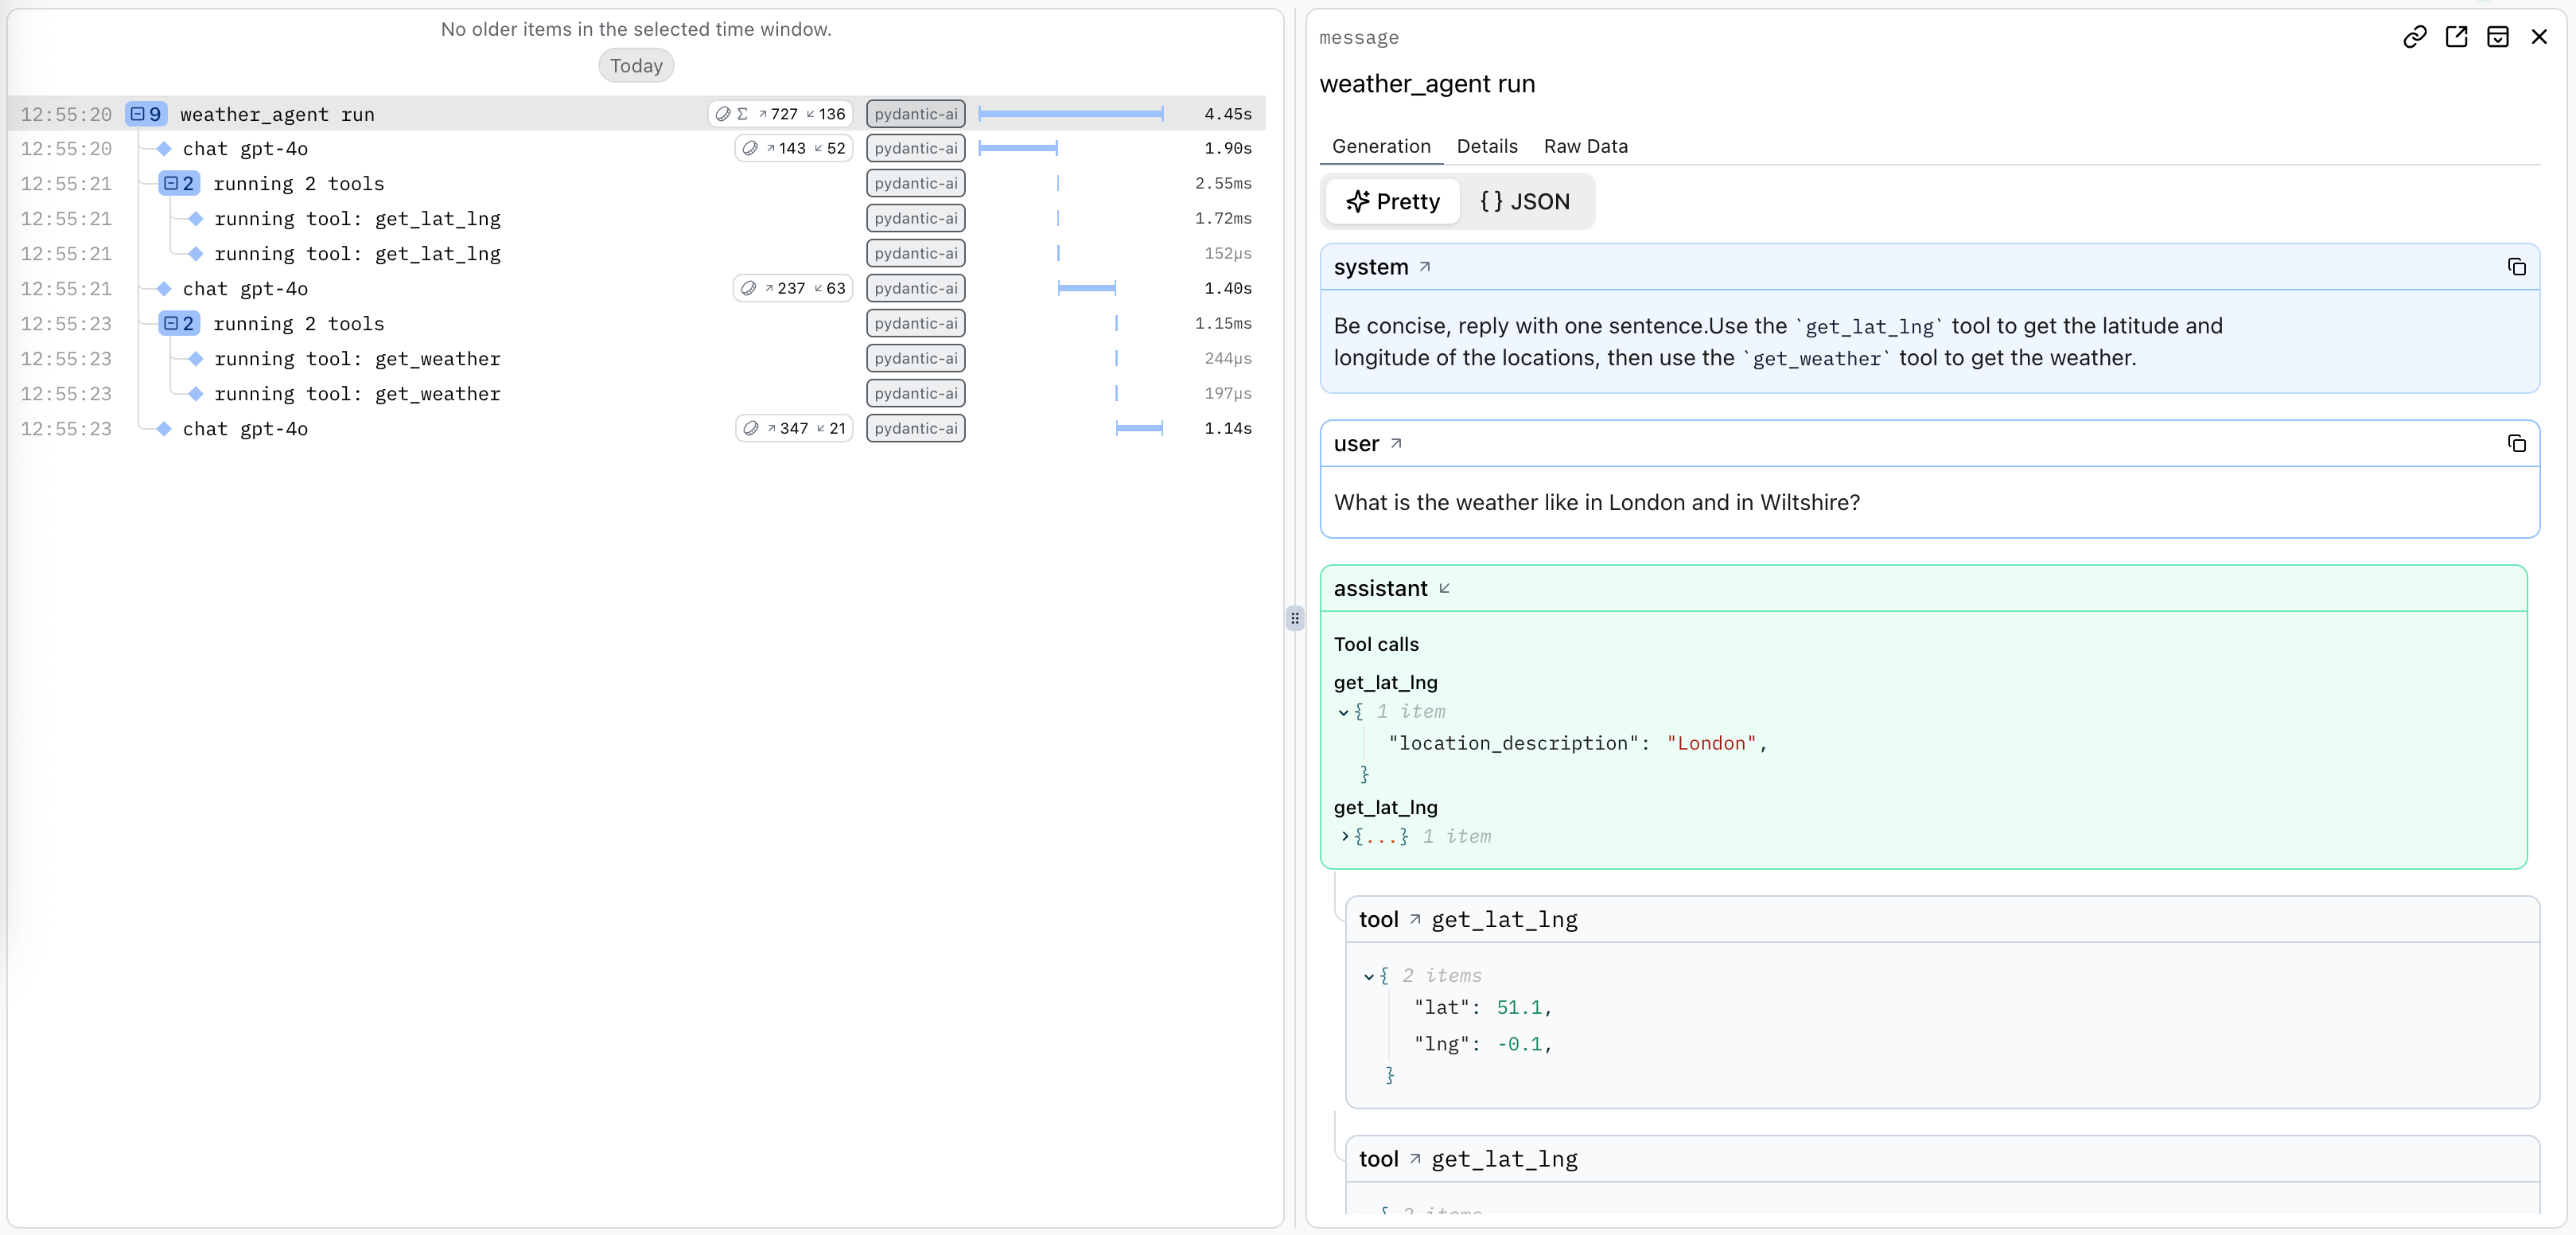
A trace is generated for the agent run, and spans are emitted for each model request and tool call.
Using Logfire
To use Logfire, you'll need a Logfire account. The Logfire Python SDK is included with pydantic-ai:
pip install pydantic-ai
uv add pydantic-ai
Or if you're using the slim package, you can install it with the logfire optional group:
pip install "pydantic-ai-slim[logfire]"
uv add "pydantic-ai-slim[logfire]"
Then authenticate your local environment with Logfire:
logfire auth
uv run logfire auth
And configure a project to send data to:
logfire projects new
uv run logfire projects new
(Or use an existing project with logfire projects use)
This will write to a .logfire directory in the current working directory, which the Logfire SDK will use for configuration at run time.
With that, you can start using Logfire to instrument Pydantic AI code:
import logfire

from pydantic_ai import Agent

logfire.configure()  # (1)!
logfire.instrument_pydantic_ai()  # (2)!

agent = Agent('gateway/openai:gpt-5.2', instructions='Be concise, reply with one sentence.')
result = agent.run_sync('Where does "hello world" come from?')  # (3)!
print(result.output)
"""
The first known use of "hello, world" was in a 1974 textbook about the C programming language.
"""
logfire.configure()configures the SDK, by default it will find the write token from the.logfiredirectory, but you can also pass a token directly.logfire.instrument_pydantic_ai()enables instrumentation of Pydantic AI.- Since we've enabled instrumentation, a trace will be generated for each run, with spans emitted for models calls and tool function execution
import logfire

from pydantic_ai import Agent

logfire.configure()  # (1)!
logfire.instrument_pydantic_ai()  # (2)!

agent = Agent('openai:gpt-5.2', instructions='Be concise, reply with one sentence.')
result = agent.run_sync('Where does "hello world" come from?')  # (3)!
print(result.output)
"""
The first known use of "hello, world" was in a 1974 textbook about the C programming language.
"""
logfire.configure()configures the SDK, by default it will find the write token from the.logfiredirectory, but you can also pass a token directly.logfire.instrument_pydantic_ai()enables instrumentation of Pydantic AI.- Since we've enabled instrumentation, a trace will be generated for each run, with spans emitted for models calls and tool function execution
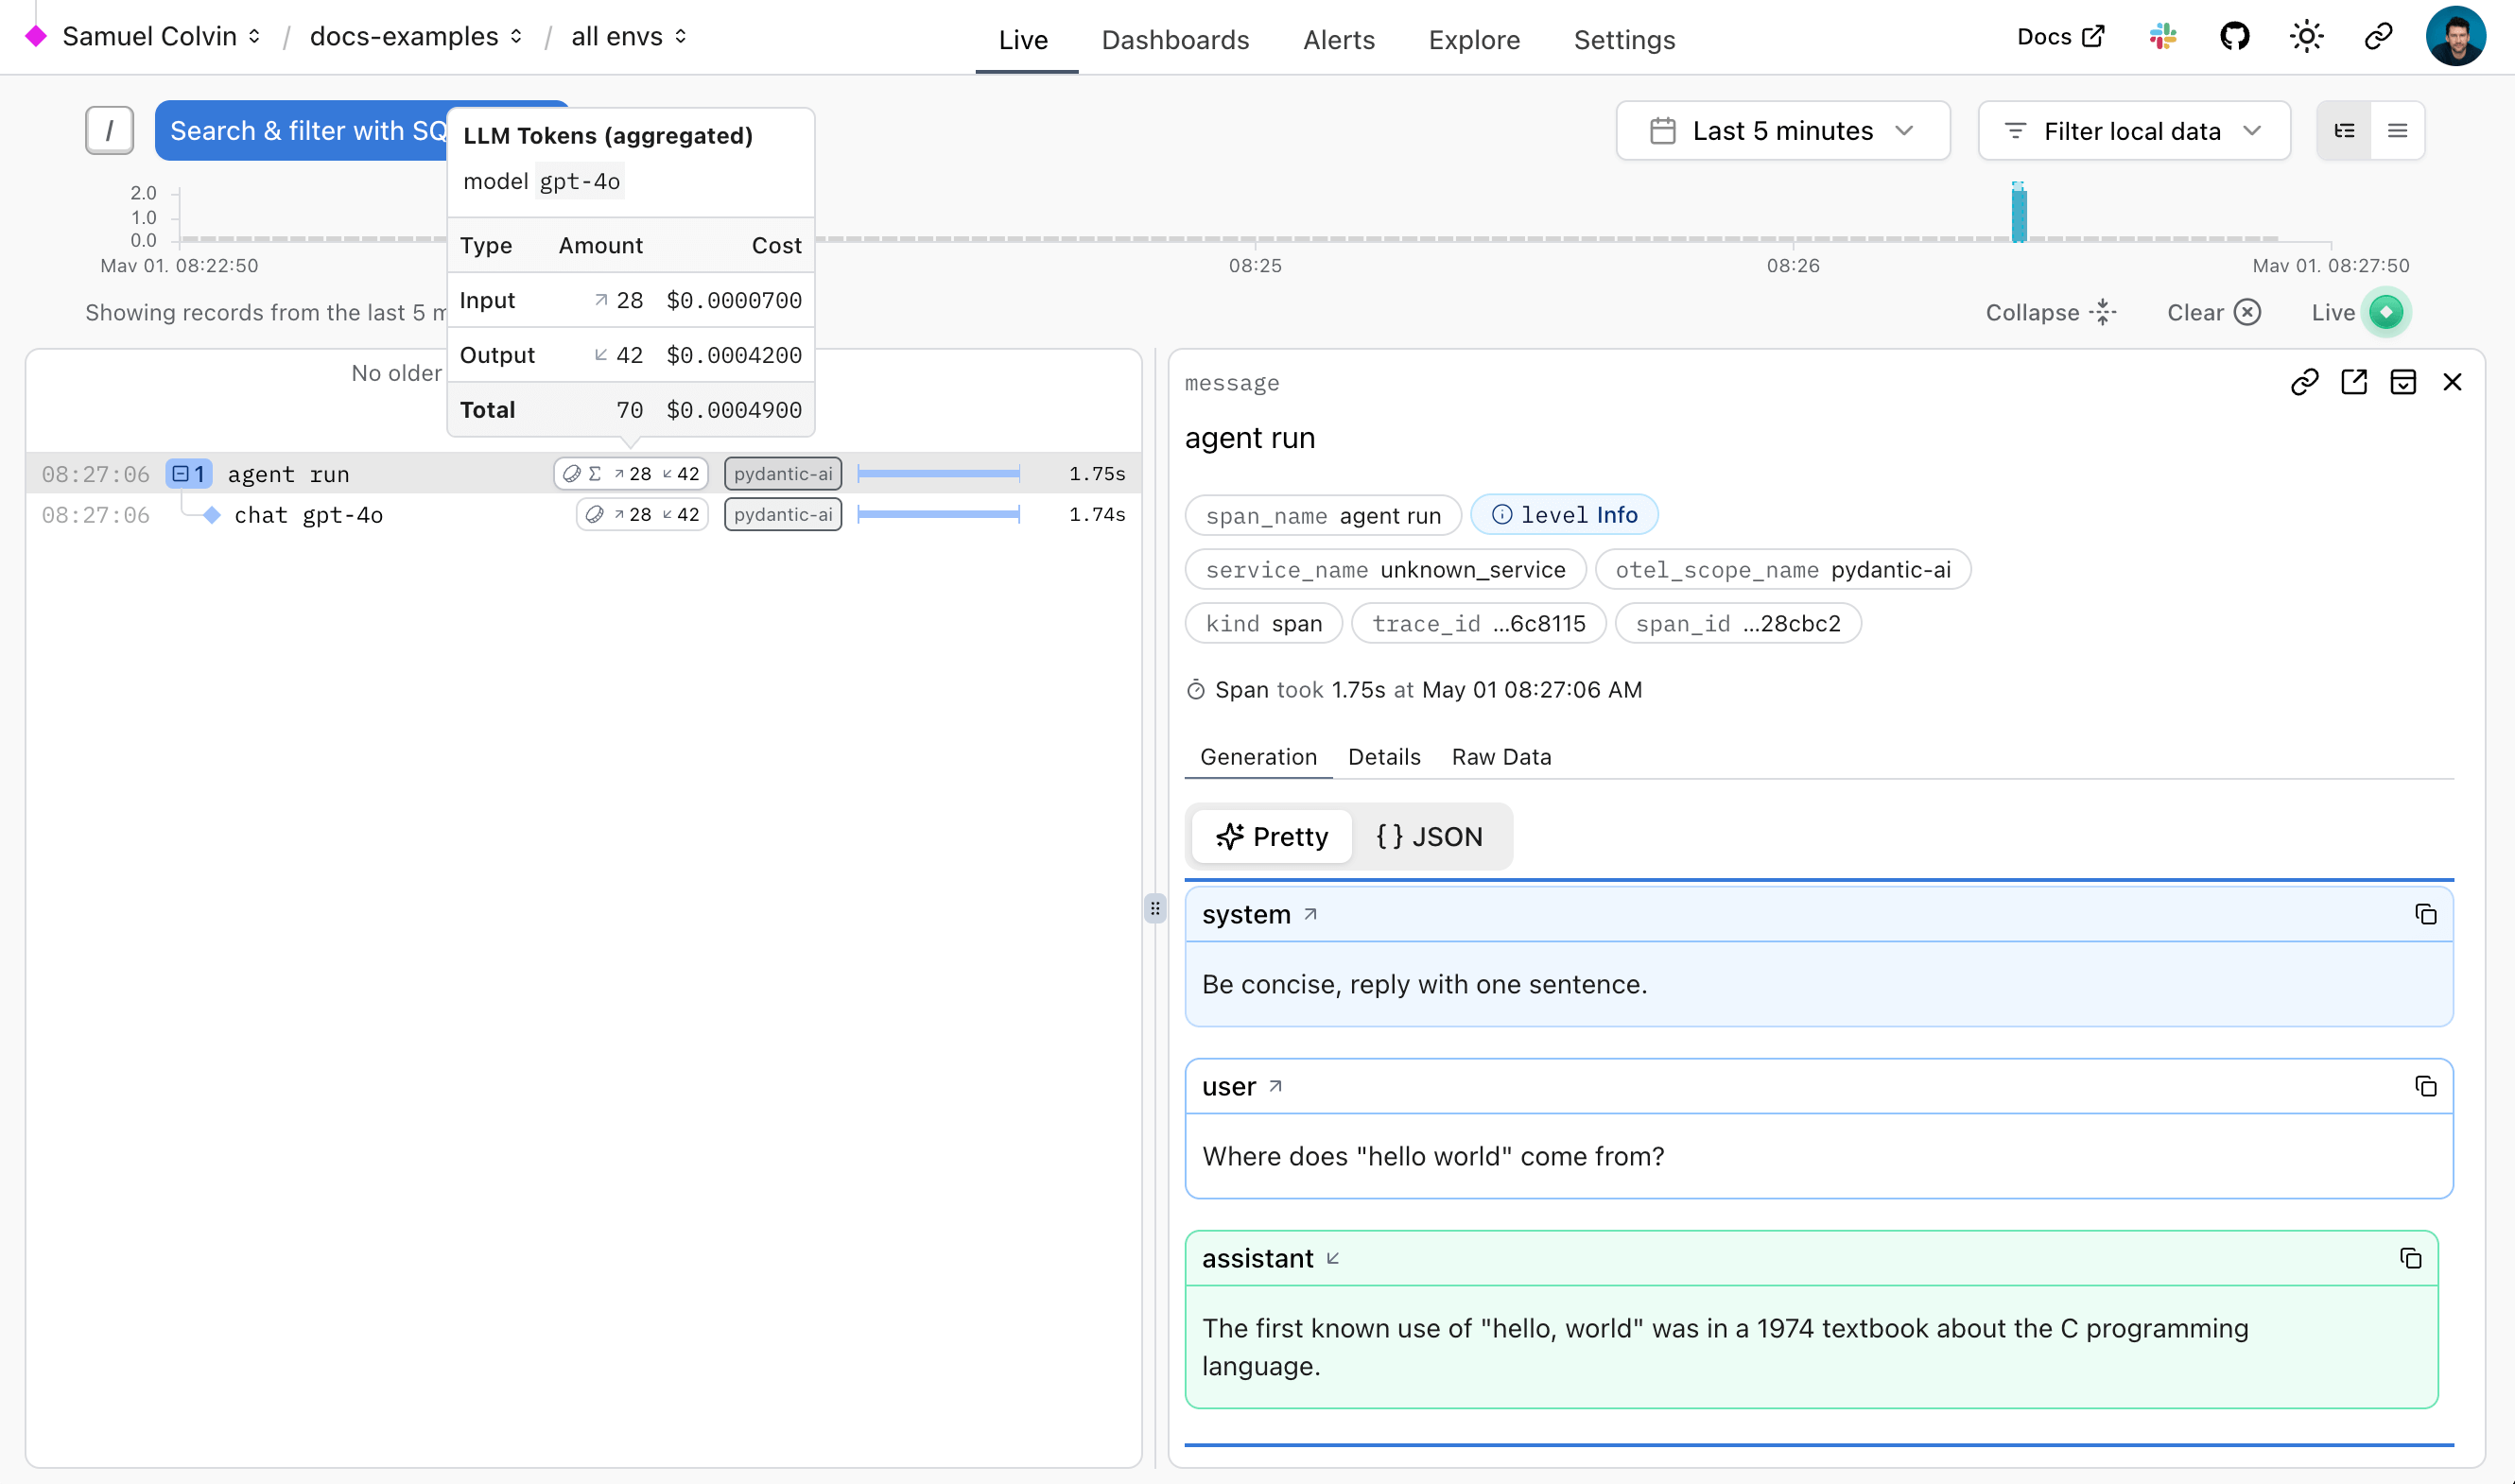
(This example is complete, it can be run "as is")
Which will display in Logfire thus:
The Logfire documentation has more details on how to use Logfire, including how to instrument other libraries like HTTPX and FastAPI.
Since Logfire is built on OpenTelemetry, you can use the Logfire Python SDK to send data to any OpenTelemetry collector, see below.
Debugging
To demonstrate how Logfire can let you visualise the flow of a Pydantic AI run, here's the view you get from Logfire while running the chat app examples:
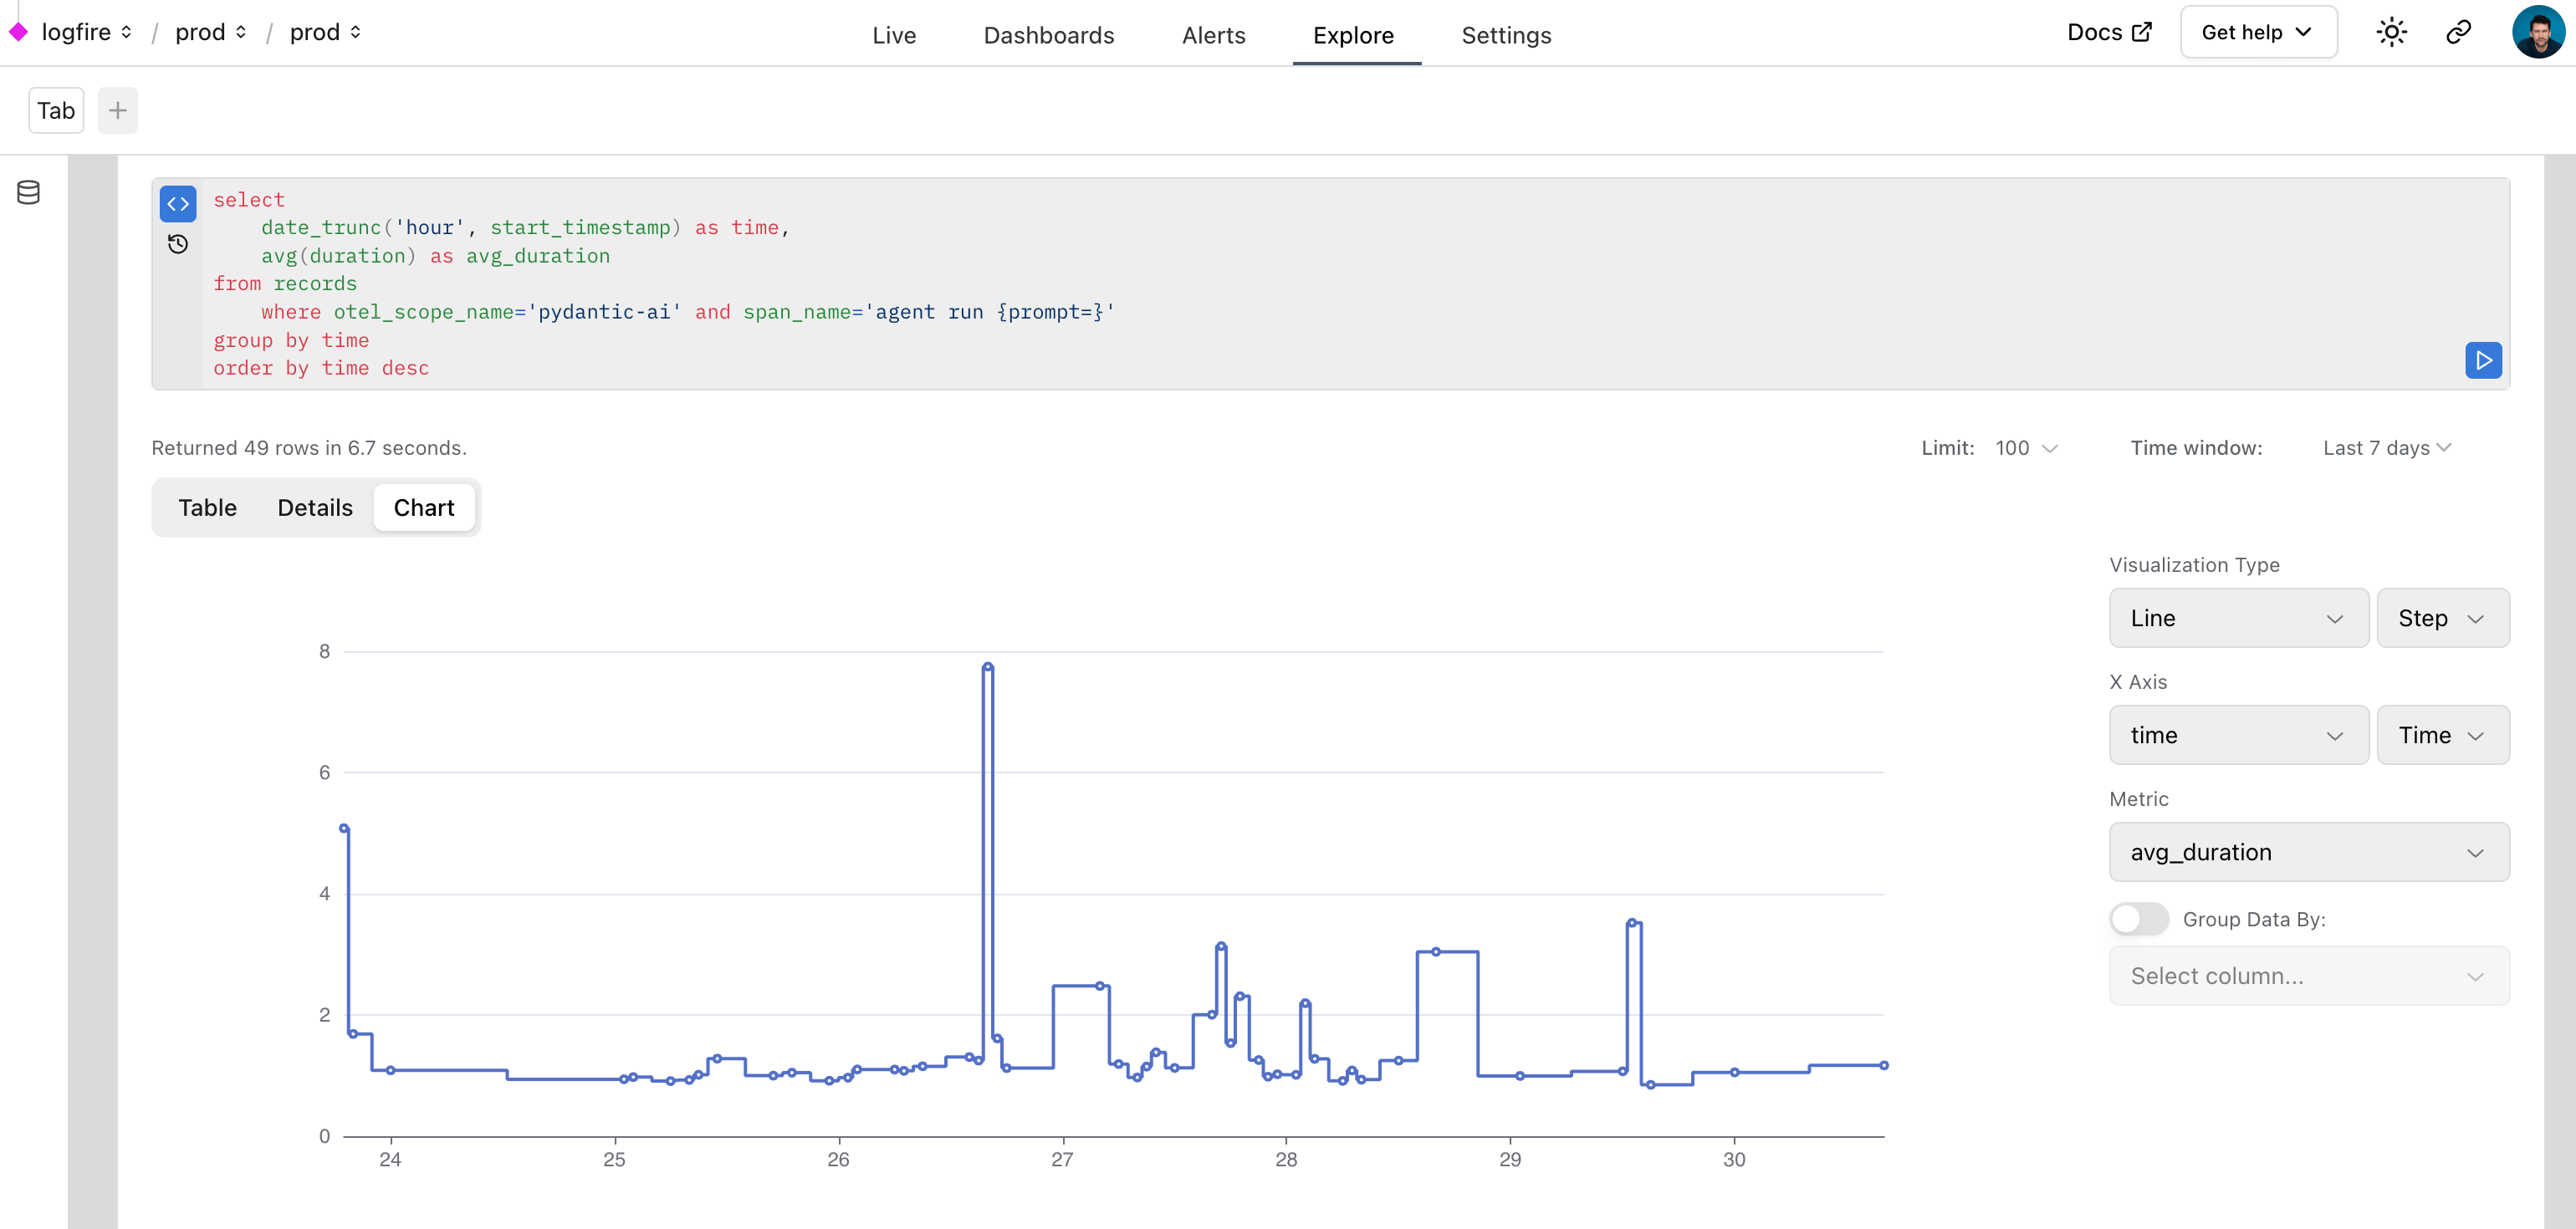
Monitoring Performance
We can also query data with SQL in Logfire to monitor the performance of an application. Here's a real world example of using Logfire to monitor Pydantic AI runs inside Logfire itself:
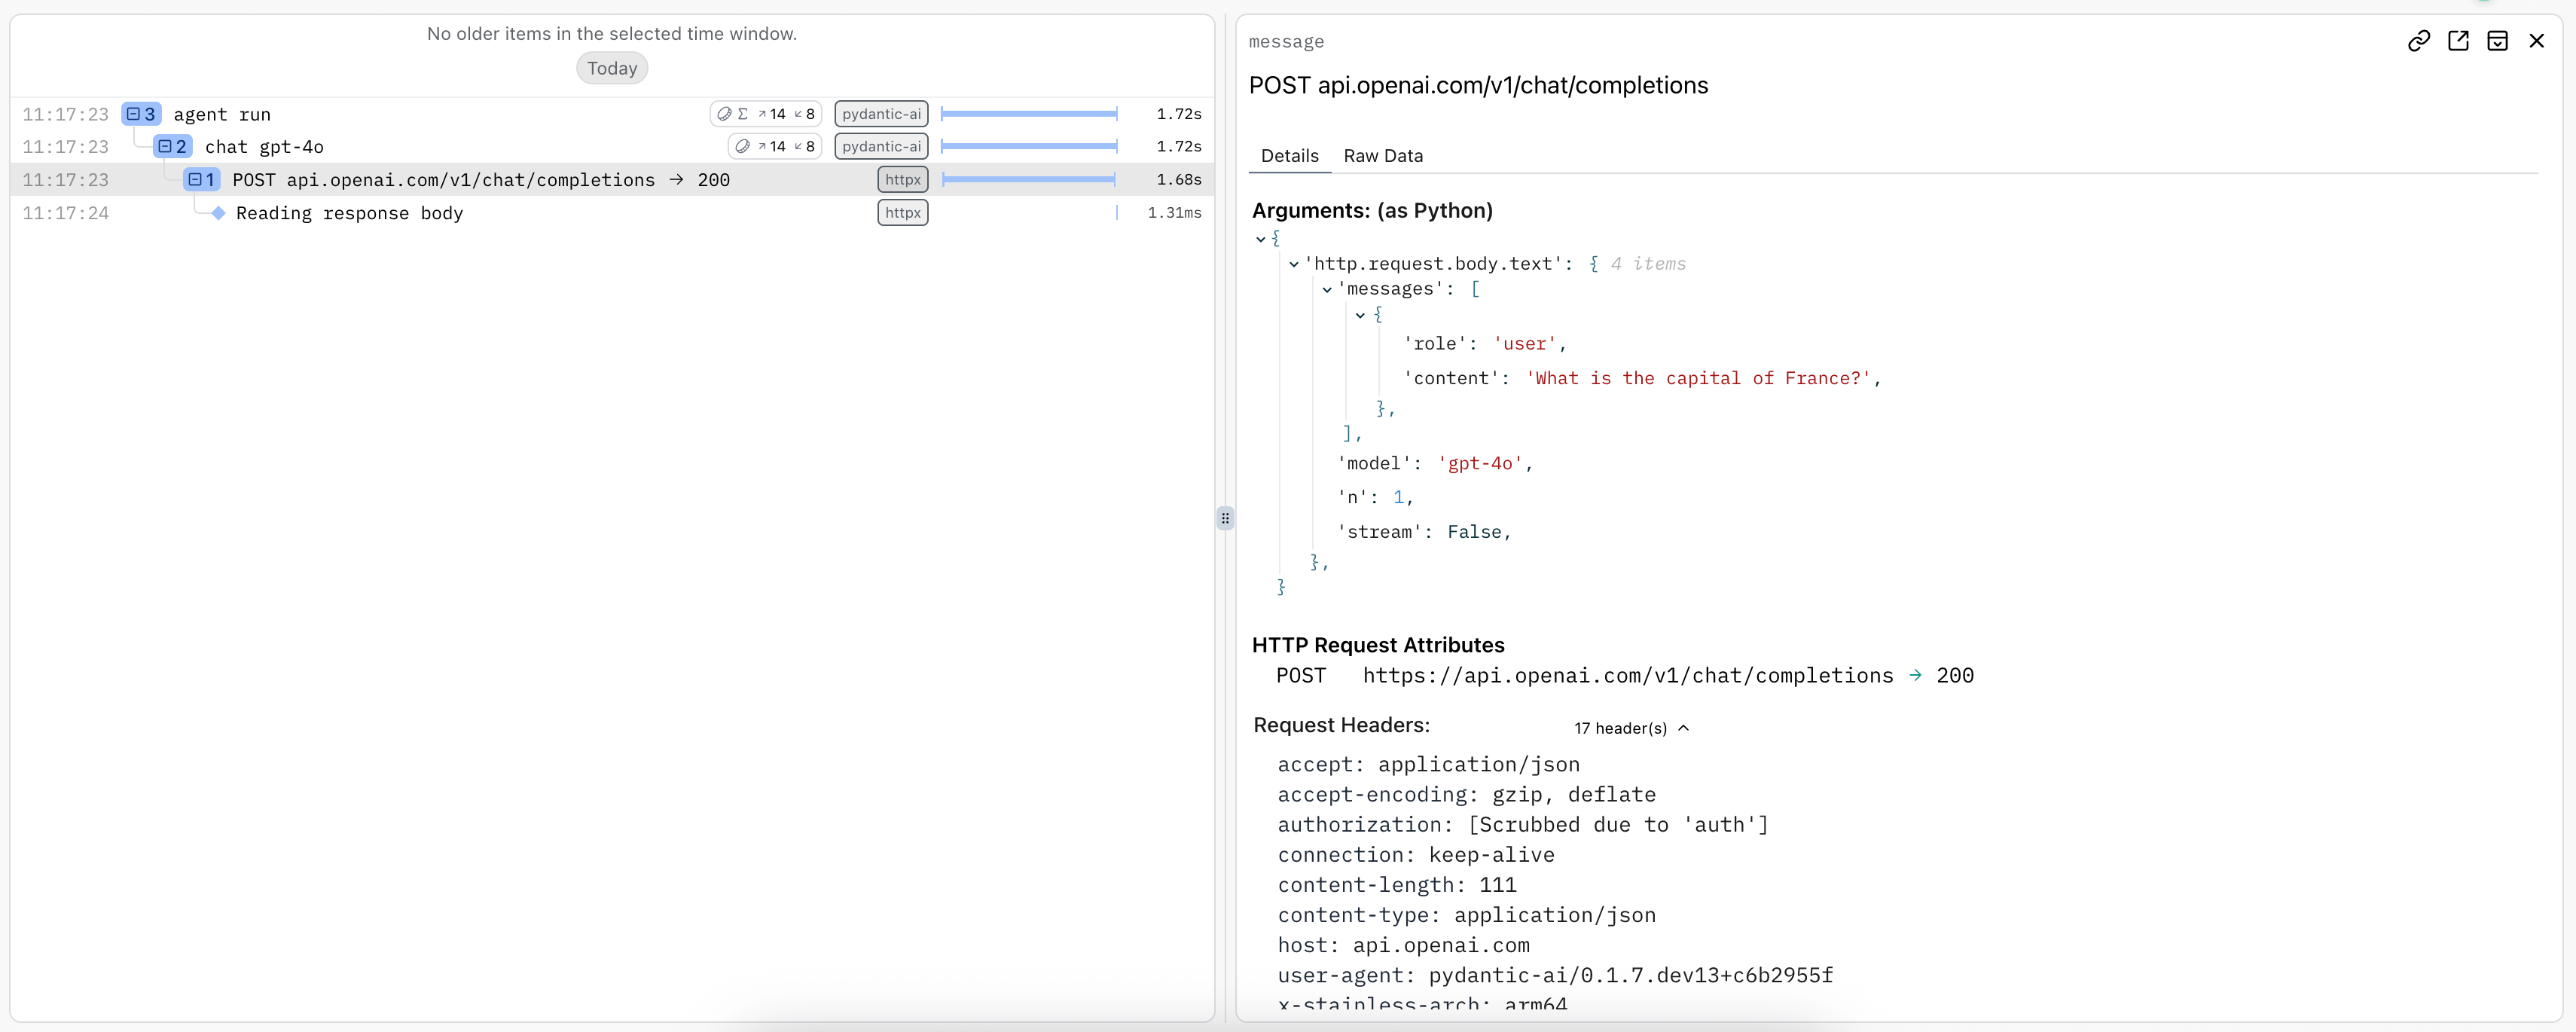
Monitoring HTTP Requests
As per Hamel Husain's influential 2024 blog post "Fuck You, Show Me The Prompt." (bear with the capitalization, the point is valid), it's often useful to be able to view the raw HTTP requests and responses made to model providers.
To observe raw HTTP requests made to model providers, you can use Logfire's HTTPX instrumentation since all provider SDKs (except for Bedrock) use the HTTPX library internally:
import logfire

from pydantic_ai import Agent

logfire.configure()
logfire.instrument_pydantic_ai()
logfire.instrument_httpx(capture_all=True)  # (1)!

agent = Agent('gateway/openai:gpt-5.2')
result = agent.run_sync('What is the capital of France?')
print(result.output)
#> The capital of France is Paris.
- See the
logfire.instrument_httpxdocs more details,capture_all=Truemeans both headers and body are captured for both the request and response.
import logfire

from pydantic_ai import Agent

logfire.configure()
logfire.instrument_pydantic_ai()
logfire.instrument_httpx(capture_all=True)  # (1)!

agent = Agent('openai:gpt-5.2')
result = agent.run_sync('What is the capital of France?')
print(result.output)
#> The capital of France is Paris.
- See the
logfire.instrument_httpxdocs more details,capture_all=Truemeans both headers and body are captured for both the request and response.
Using OpenTelemetry
Pydantic AI's instrumentation uses OpenTelemetry (OTel), which Logfire is based on.
This means you can debug and monitor Pydantic AI with any OpenTelemetry backend.
Pydantic AI follows the OpenTelemetry Semantic Conventions for Generative AI systems, so while we think you'll have the best experience using the Logfire platform  , you should be able to use any OTel service with GenAI support.
Logfire with an alternative OTel backend
You can use the Logfire SDK completely freely and send the data to any OpenTelemetry backend.
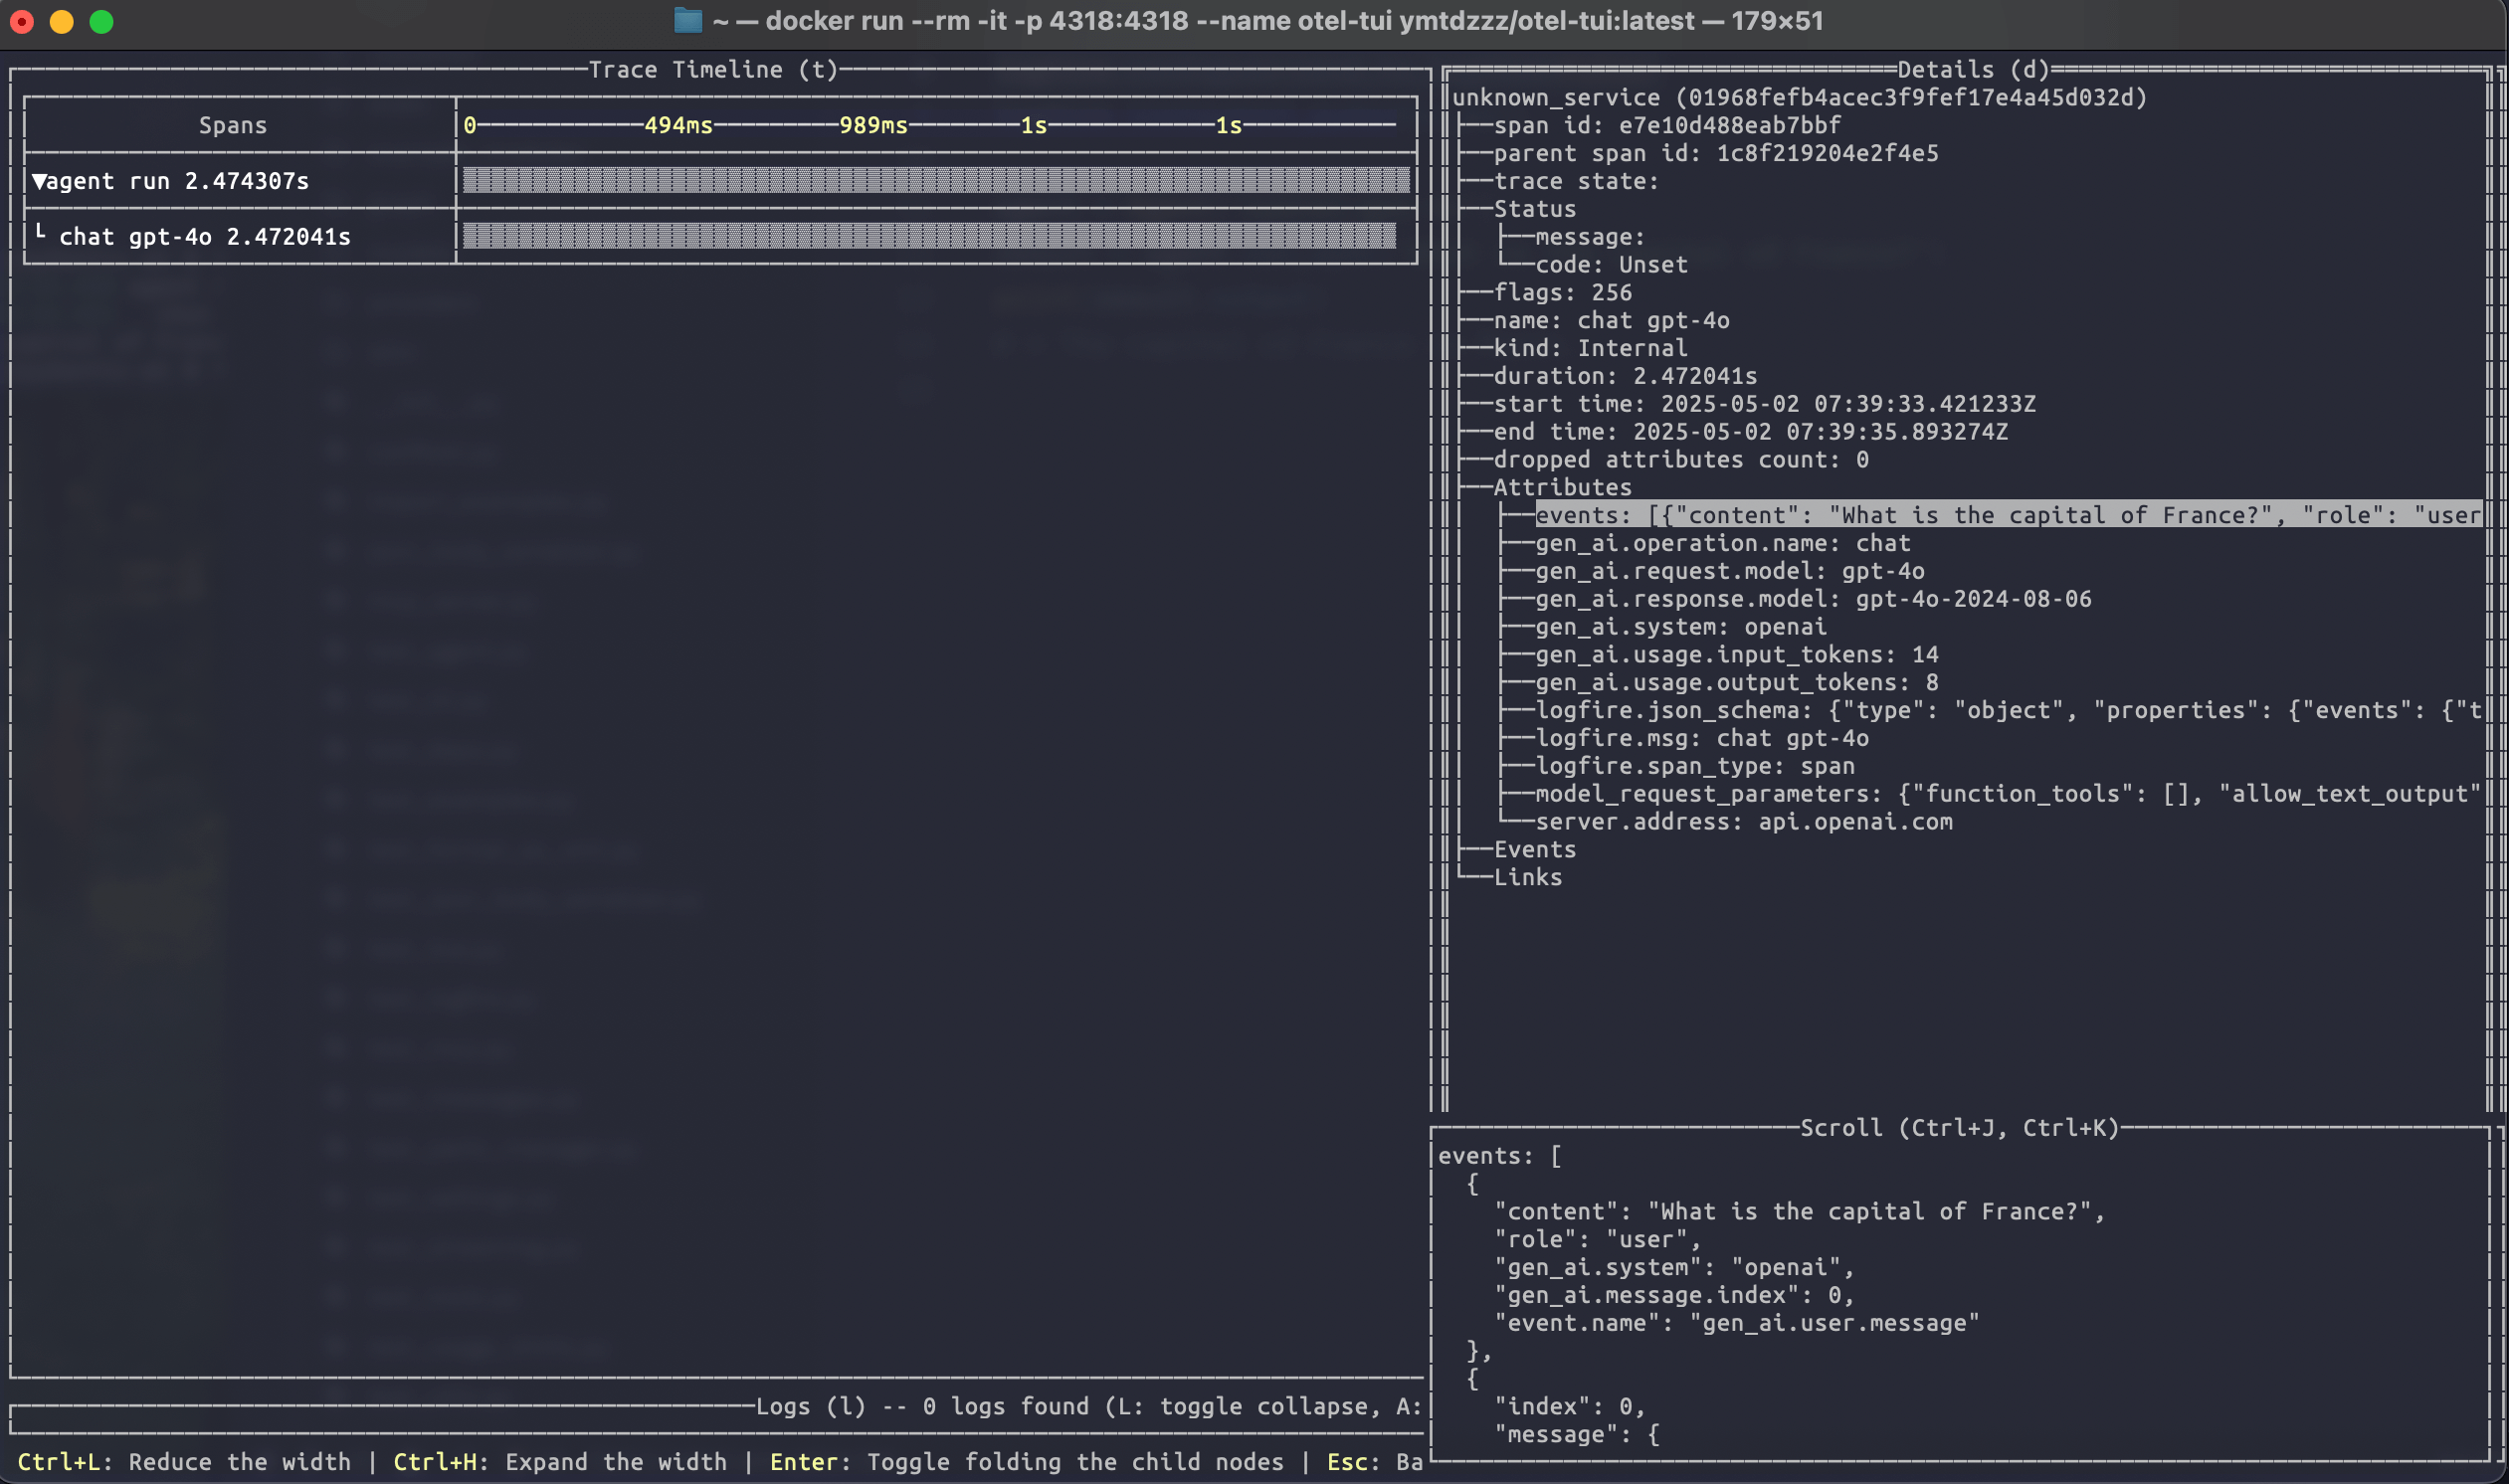
Here's an example of configuring the Logfire library to send data to the excellent otel-tui — an open source terminal based OTel backend and viewer (no association with Pydantic Validation).
Run otel-tui with docker (see the otel-tui readme for more instructions):
docker run --rm -it -p 4318:4318 --name otel-tui ymtdzzz/otel-tui:latest
then run,
import os

import logfire

from pydantic_ai import Agent

os.environ['OTEL_EXPORTER_OTLP_ENDPOINT'] = 'http://localhost:4318'  # (1)!
logfire.configure(send_to_logfire=False)  # (2)!
logfire.instrument_pydantic_ai()
logfire.instrument_httpx(capture_all=True)

agent = Agent('gateway/openai:gpt-5.2')
result = agent.run_sync('What is the capital of France?')
print(result.output)
#> Paris
- Set the
OTEL_EXPORTER_OTLP_ENDPOINTenvironment variable to the URL of your OpenTelemetry backend. If you're using a backend that requires authentication, you may need to set other environment variables. Of course, these can also be set outside the process, e.g. withexport OTEL_EXPORTER_OTLP_ENDPOINT=http://localhost:4318. - We configure Logfire to disable sending data to the Logfire OTel backend itself. If you removed
send_to_logfire=False, data would be sent to both Logfire and your OpenTelemetry backend.
import os

import logfire

from pydantic_ai import Agent

os.environ['OTEL_EXPORTER_OTLP_ENDPOINT'] = 'http://localhost:4318'  # (1)!
logfire.configure(send_to_logfire=False)  # (2)!
logfire.instrument_pydantic_ai()
logfire.instrument_httpx(capture_all=True)

agent = Agent('openai:gpt-5.2')
result = agent.run_sync('What is the capital of France?')
print(result.output)
#> Paris
- Set the
OTEL_EXPORTER_OTLP_ENDPOINTenvironment variable to the URL of your OpenTelemetry backend. If you're using a backend that requires authentication, you may need to set other environment variables. Of course, these can also be set outside the process, e.g. withexport OTEL_EXPORTER_OTLP_ENDPOINT=http://localhost:4318. - We configure Logfire to disable sending data to the Logfire OTel backend itself. If you removed
send_to_logfire=False, data would be sent to both Logfire and your OpenTelemetry backend.
Running the above code will send tracing data to otel-tui, which will display like this:
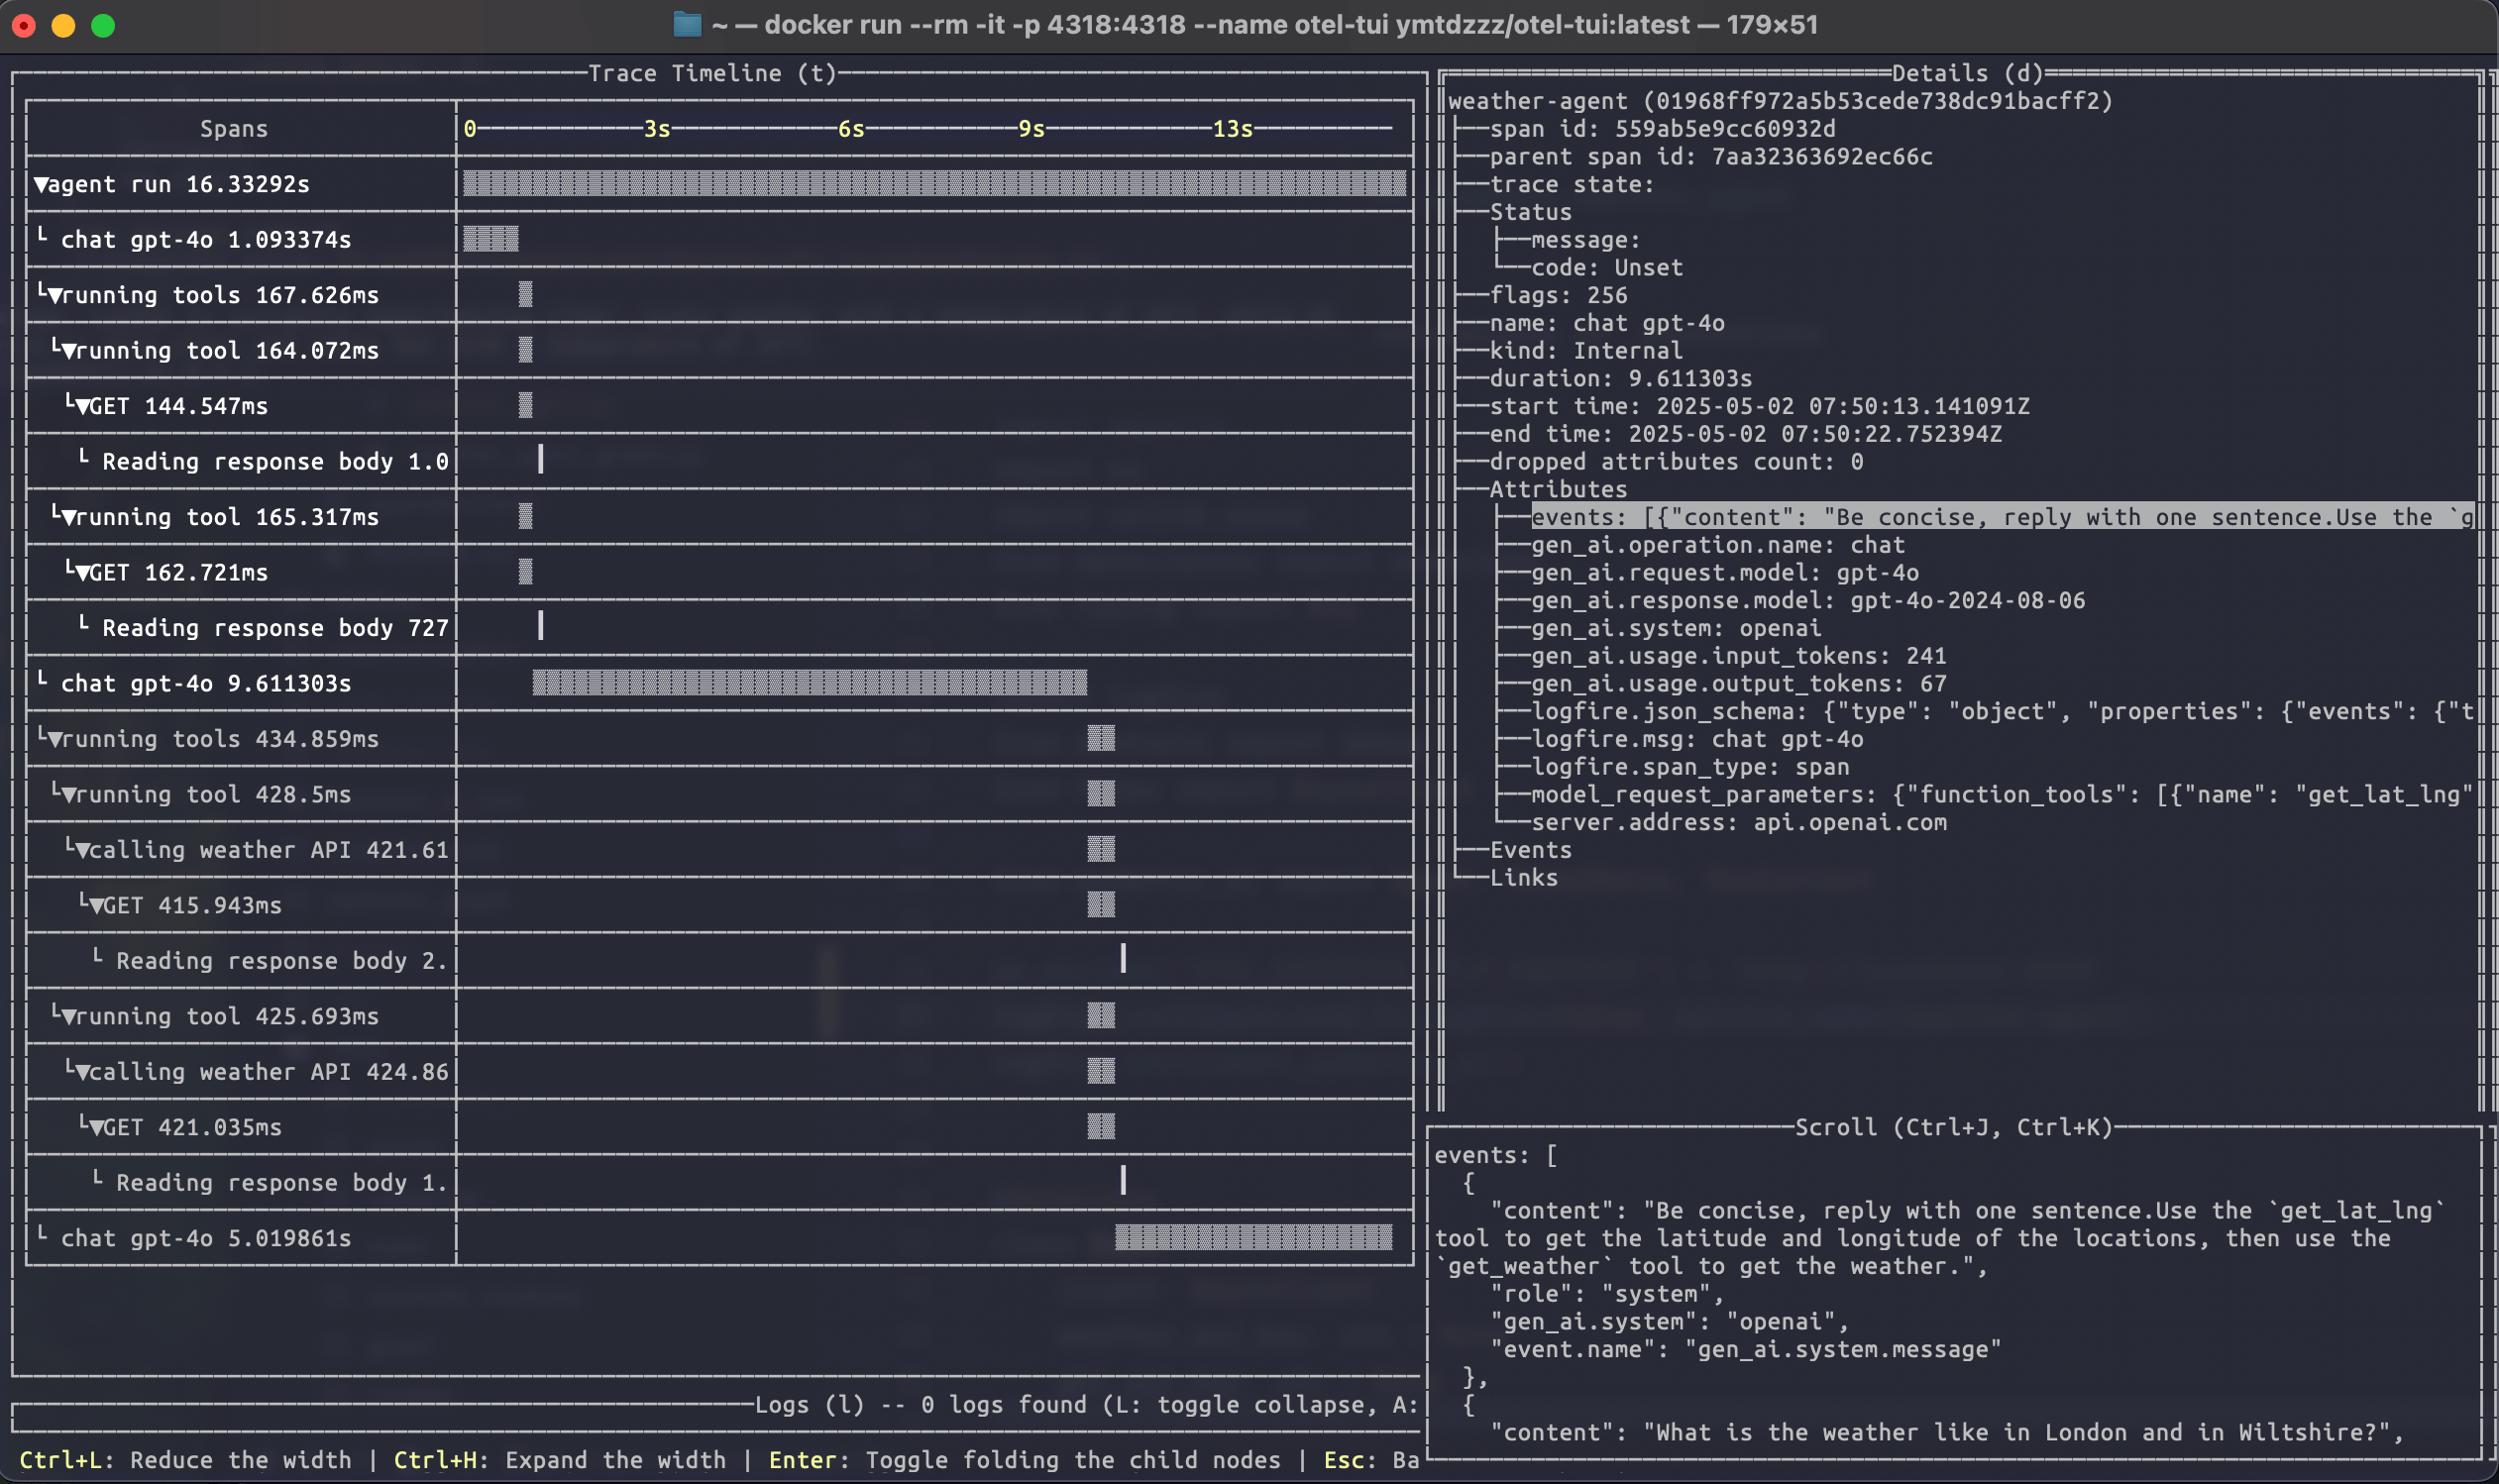
Running the weather agent example connected to otel-tui shows how it can be used to visualise a more complex trace:
For more information on using the Logfire SDK to send data to alternative backends, see the Logfire documentation.
OTel without Logfire
You can also emit OpenTelemetry data from Pydantic AI without using Logfire at all.
To do this, you'll need to install and configure the OpenTelemetry packages you need. To run the following examples, use
uv run \
  --with 'pydantic-ai-slim[openai]' \
  --with opentelemetry-sdk \
  --with opentelemetry-exporter-otlp \
  raw_otel.py
import os

from opentelemetry.exporter.otlp.proto.http.trace_exporter import OTLPSpanExporter
from opentelemetry.sdk.trace import TracerProvider
from opentelemetry.sdk.trace.export import BatchSpanProcessor
from opentelemetry.trace import set_tracer_provider

from pydantic_ai import Agent

os.environ['OTEL_EXPORTER_OTLP_ENDPOINT'] = 'http://localhost:4318'
exporter = OTLPSpanExporter()
span_processor = BatchSpanProcessor(exporter)
tracer_provider = TracerProvider()
tracer_provider.add_span_processor(span_processor)

set_tracer_provider(tracer_provider)

Agent.instrument_all()
agent = Agent('gateway/openai:gpt-5.2')
result = agent.run_sync('What is the capital of France?')
print(result.output)
#> Paris
import os

from opentelemetry.exporter.otlp.proto.http.trace_exporter import OTLPSpanExporter
from opentelemetry.sdk.trace import TracerProvider
from opentelemetry.sdk.trace.export import BatchSpanProcessor
from opentelemetry.trace import set_tracer_provider

from pydantic_ai import Agent

os.environ['OTEL_EXPORTER_OTLP_ENDPOINT'] = 'http://localhost:4318'
exporter = OTLPSpanExporter()
span_processor = BatchSpanProcessor(exporter)
tracer_provider = TracerProvider()
tracer_provider.add_span_processor(span_processor)

set_tracer_provider(tracer_provider)

Agent.instrument_all()
agent = Agent('openai:gpt-5.2')
result = agent.run_sync('What is the capital of France?')
print(result.output)
#> Paris
Alternative Observability backends
Because Pydantic AI uses OpenTelemetry for observability, you can easily configure it to send data to any OpenTelemetry-compatible backend, not just our observability platform Pydantic Logfire.
The following providers have dedicated documentation on Pydantic AI:
- Langfuse
- W&B Weave
- Arize
- Openlayer
- OpenLIT
- LangWatch
- Patronus AI
- Opik
- mlflow
- Agenta
- Confident AI
- Braintrust
- SigNoz
- Laminar
Advanced usage
Aggregated usage attribute names
By default, both model/request spans and agent run spans use the standard gen_ai.usage.input_tokens and gen_ai.usage.output_tokens attributes. Some observability backends (e.g., Datadog, New Relic, LangSmith, Opik) aggregate these attributes across all spans, which can cause double-counting since agent run spans report the sum of their child spans' usage.
To avoid this, you can enable use_aggregated_usage_attribute_names so that agent run spans use distinct attribute names (e.g., gen_ai.aggregated_usage.input_tokens, gen_ai.aggregated_usage.output_tokens, and gen_ai.aggregated_usage.details.*):
Custom namespace
The gen_ai.aggregated_usage.* namespace is a custom extension not part of the OpenTelemetry Semantic Conventions for GenAI. It was introduced to work around double-counting in observability backends. If OpenTelemetry introduces an official convention for aggregated usage in the future, this namespace may be updated or deprecated.
from pydantic_ai import Agent
from pydantic_ai.models.instrumented import InstrumentationSettings

Agent.instrument_all(InstrumentationSettings(use_aggregated_usage_attribute_names=True))
Configuring data format
Pydantic AI follows the OpenTelemetry Semantic Conventions for Generative AI systems, specifically version 1.37.0 of the conventions. The instrumentation format can be configured using the version parameter of InstrumentationSettings.
The default is version=2, which provides a good balance between spec compliance and compatibility.
Version 1 (Legacy, deprecated)
Based on OpenTelemetry semantic conventions version 1.36.0 or older. Messages are captured as individual events (logs) that are children of the request span. Use event_mode='logs' to emit events as OpenTelemetry log-based events:
import logfire

from pydantic_ai import Agent

logfire.configure()
logfire.instrument_pydantic_ai(version=1, event_mode='logs')
agent = Agent('gateway/openai:gpt-5.2')
result = agent.run_sync('What is the capital of France?')
print(result.output)
#> The capital of France is Paris.
import logfire

from pydantic_ai import Agent

logfire.configure()
logfire.instrument_pydantic_ai(version=1, event_mode='logs')
agent = Agent('openai:gpt-5.2')
result = agent.run_sync('What is the capital of France?')
print(result.output)
#> The capital of France is Paris.
This version won't look as good in the Logfire UI and will be removed from Pydantic AI in a future release, but may be useful for backwards compatibility.
Version 2 (Default)
Uses the newer OpenTelemetry GenAI spec and stores messages in the following attributes:
gen_ai.system_instructionsfor instructions passed to the agentgen_ai.input.messagesandgen_ai.output.messageson model request spanspydantic_ai.all_messageson agent run spans
Some span and attribute names are not fully spec-compliant for compatibility reasons. Use version 3 or 4 for better compliance.
Version 3
Builds on version 2 with the following improvements:
- Spec-compliant span names:
agent runbecomesinvoke_agent {gen_ai.agent.name}(with the agent name filled in)running toolbecomesexecute_tool {gen_ai.tool.name}(with the tool name filled in)
- Spec-compliant attribute names:
tool_argumentsbecomesgen_ai.tool.call.argumentstool_responsebecomesgen_ai.tool.call.result
- Thinking tokens support: Captures thinking/reasoning tokens when available
Version 4
Builds on version 3 with improved multimodal content handling to better align with the GenAI semantic conventions for multimodal inputs:
URL-based media (ImageUrl, AudioUrl, VideoUrl):
- Old (v1-3):
{"type": "image-url", "url": "..."} - New (v4):
{"type": "uri", "modality": "image", "uri": "...", "mime_type": "..."}
Inline binary content (BinaryContent, FilePart):
- Old (v1-3):
{"type": "binary", "media_type": "...", "content": "..."} - New (v4):
{"type": "blob", "modality": "image", "mime_type": "...", "content": "..."}
Note: The modality field is only included for image, audio, and video content types as specified in the OTel spec. DocumentUrl and unsupported media types omit the modality field.
Note that the OpenTelemetry Semantic Conventions are still experimental and are likely to change.
Setting OpenTelemetry SDK providers
By default, the global TracerProvider and LoggerProvider are used. These are set automatically by logfire.configure(). They can also be set by the set_tracer_provider and set_logger_provider functions in the OpenTelemetry Python SDK. You can set custom providers with InstrumentationSettings.
from opentelemetry.sdk._logs import LoggerProvider
from opentelemetry.sdk.trace import TracerProvider

from pydantic_ai import Agent, InstrumentationSettings

instrumentation_settings = InstrumentationSettings(
    tracer_provider=TracerProvider(),
    logger_provider=LoggerProvider(),
)

agent = Agent('gateway/openai:gpt-5.2', instrument=instrumentation_settings)
# or to instrument all agents:
Agent.instrument_all(instrumentation_settings)
from opentelemetry.sdk._logs import LoggerProvider
from opentelemetry.sdk.trace import TracerProvider

from pydantic_ai import Agent, InstrumentationSettings

instrumentation_settings = InstrumentationSettings(
    tracer_provider=TracerProvider(),
    logger_provider=LoggerProvider(),
)

agent = Agent('openai:gpt-5.2', instrument=instrumentation_settings)
# or to instrument all agents:
Agent.instrument_all(instrumentation_settings)
Instrumenting a specific Model
from pydantic_ai import Agent
from pydantic_ai.models.instrumented import InstrumentationSettings, InstrumentedModel

settings = InstrumentationSettings()
model = InstrumentedModel('openai:gpt-5.2', settings)
agent = Agent(model)
Excluding binary content
from pydantic_ai import Agent, InstrumentationSettings

instrumentation_settings = InstrumentationSettings(include_binary_content=False)

agent = Agent('gateway/openai:gpt-5.2', instrument=instrumentation_settings)
# or to instrument all agents:
Agent.instrument_all(instrumentation_settings)
from pydantic_ai import Agent, InstrumentationSettings

instrumentation_settings = InstrumentationSettings(include_binary_content=False)

agent = Agent('openai:gpt-5.2', instrument=instrumentation_settings)
# or to instrument all agents:
Agent.instrument_all(instrumentation_settings)
Excluding prompts and completions
For privacy and security reasons, you may want to monitor your agent's behavior and performance without exposing sensitive user data or proprietary prompts in your observability platform. Pydantic AI allows you to exclude the actual content from telemetry while preserving the structural information needed for debugging and monitoring.
When include_content=False is set, Pydantic AI will exclude sensitive content from telemetry, including user prompts and model completions, tool call arguments and responses, and any other message content.
from pydantic_ai import Agent
from pydantic_ai.models.instrumented import InstrumentationSettings

instrumentation_settings = InstrumentationSettings(include_content=False)

agent = Agent('gateway/openai:gpt-5.2', instrument=instrumentation_settings)
# or to instrument all agents:
Agent.instrument_all(instrumentation_settings)
from pydantic_ai import Agent
from pydantic_ai.models.instrumented import InstrumentationSettings

instrumentation_settings = InstrumentationSettings(include_content=False)

agent = Agent('openai:gpt-5.2', instrument=instrumentation_settings)
# or to instrument all agents:
Agent.instrument_all(instrumentation_settings)
This setting is particularly useful in production environments where compliance requirements or data sensitivity concerns make it necessary to limit what content is sent to your observability platform.
Adding Custom Metadata
Use the agent's metadata parameter to attach additional data to the agent's span.
When instrumentation is enabled, the computed metadata is recorded on the agent span under the metadata attribute.
See the usage and metadata example in the agents guide for details and usage.